High User Traffic Incident Retrospective - Thursday September 2, 2021

Boundary nodes throttling users access to query and update calls of canisters on subnet pjljw

Summary

An NFT project launched fully on 2021-09-01 20:00 UTC with earlier waves at 2021-09-01 16:00 UTC and 2021-09-01 19:00 UTC. The first wave at 16:00 UTC kicked off an increased volume of traffic to the subnet pjljw.

This traffic increased steadily and started to hit against the rate limits configured on the boundary nodes. The boundary nodes began limiting requests to canisters on the subnet. This caused impact to the project’s canister (responsible for the vast majority of the traffic):

As well as other canisters on the subnet.

The effective impact of this was that many users were unable to load applications on the webpage or interact with canisters as the majority of messages during this period of time were either rate limited or rejected by the replica. In the project’s case, many users were unable to load the application fully and claim their NFT.

During the peak period at 20:00 UTC, traffic increased dramatically, peaking at just over 38k requests/sec.

During earlier waves, the replicas and subnet behaved normally. During the peak period, an influx of heavy update traffic (202 call submit) came in going from 18 updates/s to over 1k updates/s to the subnet.

Close up for the critical time period:

This caused a dip in finalization rate from around 1 block/s to a bit over 0.3 blocks/s.

During this period, heavy ingress message throttling was observed, reaching levels of over 50 messages/s.

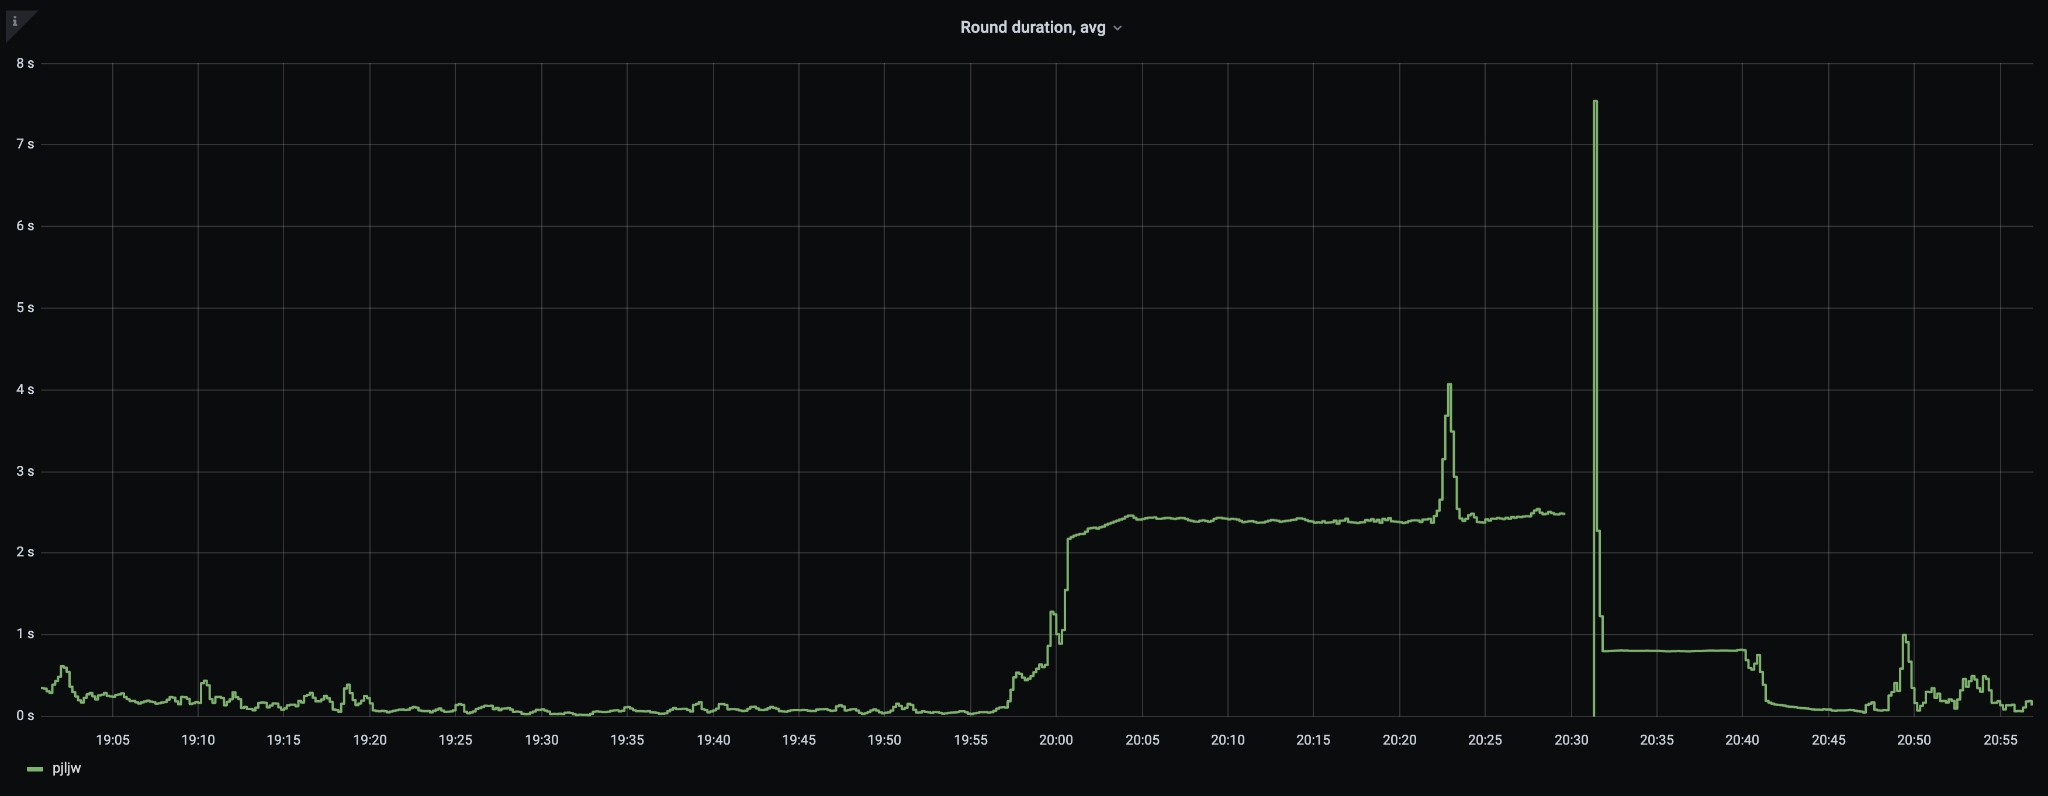
Execution round instruction went to over 1.8 billion and execution rounds were taking around 2.5 seconds (with large outliers).

During the peak period, client side (browser console log) visiting the project’s asset canister, directly served from the IC, shows a ton of error code 500 returned from boundary.ic0.app. Its frontend requires many assets to load to become fully functional: this explains why so many users were not able to do anything except keep reloading the page.

Timeline (UTC)

  • 2021-09-01T16:00 - The first wave of NFT claiming and countdown starts.
  • 2021-09-01T16:15 - Rate limiting by the boundary nodes is observed on query calls, a pattern which continues to increase as 20:00 approaches.
  • 2021-09-01T19:00 - The second wave of NFT claiming occurs; this causes further increases in traffic, but update volume is still low as this group has a limited number of participants.
  • 2021-09-01T20:00 - The main drop of NTFs occurs and traffic dramatically increases, peaking at 38k req/s to the boundary nodes. Subnet pjljw finalization rate drops to 0.3 blocks/s
  • 2021-09-01T20:05 - The ICA dashboard is observed to fail to load during this period.
  • 2021-09-01T20:40 - Traffic tapers off as the drop ends and project shows sold out. Traffic drops to 10k req/s and continues to drop as time goes on.
  • 2021-09-01T20:45 - The ICA dashboard returns to normal operation.
  • 2021-09-01T20:45 - Subnet pjljw returns back to normal finalization rate.

What caused the disruption?

High query load to a few canisters caused the rate limiting. The high update load caused the subnet performance to degrade afterwards. These two factors resulted in the project’s applications along with other canisters on the subnet being inaccessible to many users.

What went wrong?

The IC replicas were not serving real user traffic anywhere close to the theoretical maximum rate.

What went right?

The subnet pjljw continued processing queries and updates and did not fail despite the high traffic. The boundary nodes also continued successfully serving traffic. The rate limiting protections worked well and protected the subnet from the bulk of the traffic, which unfiltered could have caused more disruption in the subnetwork replicas.

Follow-up action Items

  • Improve documentation on how to scale decentralized applications on the IC.
  • Enable (standards compliant) caching of HTTP on the boundary nodes and communicate best practices to developers.
  • Evaluate query API call result caching on replicas within a block interval.
  • Use more threads for Execution (currently we are single threaded using 1 of 64 cores).
  • Load test and tune the rate limits based on more realistic traffic loads.
37 Likes

I was experiencing network request errors on the NNS app and Distrikt I believe around the same time periods. Were other subnets affected? It seemed like almost a general slowdown, is there any evidence for this?

7 Likes

The follow-up action items seem to suggest that this could of been avoided by the developer.
Can someone go into this further?

The rate limiting is interesting. I can understand a rate limit per an IP, but what is the purpose of a general rate limit?

The only appeal to me for IC right now (because it’s quite centralized in practice) is the ability to not have to worry about handling the complexity of dev operations relating to scaling, uptime, and performance. Let’s hope this never happens again on the IC because it looks really bad given how the technology was touted and how load balanced static-content competitors could of handled this load.

I think your expectations are a bit high for a beta product. This will likely happen many more times as performance is dialed in and people best understand how to use the IC. This happens to all networks and while there are some optimizations to be done here, on of the lessons is don’t do a hype event where you steal hundreds of thousands of people’s time trying to give them something for free only during a certain window. Anyone remember what Cryptokitties did to the ETH network? Or seen the gas prices lately? Keep in mind that all those requests went through and all the NFTs were distributed at a constant cycle rate…that seems like a win too.

The follow-up action items seem to suggest that this could of been avoided by the developer.
Can someone go into this further?

Have people register over a long period of time and then use the random beacon to distribute and you avoid this entire situation.

17 Likes

The transparency is appreciated. As stated, the necessary guardrails were not in place to protect the subnet operation from a single application negatively impacting service availability. This is serious and rating limits need to be tweaked ASAP.

How does an application know that there is an issue? Is an event thrown that is visible to the application to indicate a performance threshold has been hit? Is there a performance monitoring api exposed to the developer? Not sure if there is a performance dashboard that is accessible. The IC is supposed to hide all the complexity and get the developer out of the Operations role.

Educating developers is great but expect malicious actors to do the opposite.

This is a beta product so glitches are expected. Perfection is not what is needed. However, timely corrective action is needed. The corrective actions should be tracked and put forward as NNS proposals when ready for deployment and made visible.

Thanks for sharing the report. Far better than what industry has been providing IMHO.

15 Likes

What’s dfinity doing to avoid the same in the future? And how long will it take?

2 Likes

“The IC replicas were not serving real user traffic anywhere close to the theoretical maximum rate.” - What is theoretical maximum rate for this number of nodes in current subnet? queries and updates.

Also it is very interesting to know the relation between adding nodes to subnet and throughput for updates, how many updates can handle one submet?

1 Like

Wow, this sounds like such a waste. What’s the plan for utilizing the full capability of the hardware?

3 Likes

I was experiencing network request errors on the NNS app and Distrikt I believe around the same time periods. Were other subnets affected? It seemed like almost a general slowdown, is there any evidence for this?

Looking at the dashboard for the NNS subnet, there’s a slight increase in traffic with a corresponding increase in “CalledTrap” errors; as in some canister, presumably Internet Identity, explicitly called trap / panic (and if I had to guess, that would be something like using the wrong YubiKey). But the error rate is consistently well under .5 TPS and mostly under .1 TPS.

It could have been boundary node throttling or something completely different, but I’m not seeing it.

2 Likes

I experienced issues logging in and using NNS App at this time too. Was it related? Also, there were cors errors on the browser console, did the throttling cause that?

1 Like

It’s not a general rate limit, it’s a rate limit per subnet. All replicas on a subnet do the exact same replicated workload (ingress message and canister message execution) and share the same query load (round-robin) so it makes sense that they share the same rate limits.

Let’s hope this never happens again on the IC because it looks really bad given how the technology was touted and how load balanced static-content competitors could of handled this load.

Yes, there’s still a lot of work to do (including optimization) and this the first time we’ve experienced this level of traffic on a single subnet. That being said, the scalability claims were made for the whole of the IC, not for single canisters. There is only so much a single-threaded canister can scale before it hits a wall. (And canisters need to be single-threaded because they need to be deterministic. There may well be more elaborate solutions to that, but the IC is not there yet.)

7 Likes

Not yet. What we’re using internally to monitor NNS canisters is a hand-rolled Prometheus / OpenMetrics /metrics query endpoint where we export timestamped metrics (queries handled, Internet Identities created, etc.). Timestamped because you can’t guarantee which replica you will be hitting and some replicas may be behind. Prometheus will drop samples with duplicated or regressing timestamps, so this solves the issue of counters going back.

Of course, a lot more than that can be provided by the IC directly, but there is data privacy to be taken into consideration and we’re still working down our priority list.

4 Likes

This 1 core limit only applies to this one subnet and (by total coincidence) was introduced earlier this week, due to limitations we hit because of another canister (with updates and queries that read and wrote tens of MB of memory each) and how that interacted with our orthogonal persistence implementation (which uses mprotect to track dirty memory pages; and that we’re already working on optimizing).

The other thing that we’re working on is canister migration (to other subnets), but that’s still in the design stages. We will share a proposal when we have something more solid. Canister migration would have allowed us to move ICPunks to a different subnet, which would not have made a huge difference to ICPunks itself, but would have had less of an impact on other canisters on the subnet (due to there being 64 cores available for execution).

5 Likes

Thank you for being able to provide so much information transparently.

Looking forward to the documentation about These.

I encountered a problem before, there is a choice, 1. Double the storage, such as adding a hashmap, the advantage is that only O(1) complexity when querying. 2. No double the storage, but it is O(N) when querying, need to traverse the array and make some judgments, I don’t know which is better.

1 Like

I don’t think the subnet could have served a lot more update traffic for the ICPunks canister. It was already running into the instructions per round limit (which is there to ensure blocks are executed in a timely fashion, so block rate is kept up; and to prevent one canister from hogging a single CPU core for a very long time while all other canisters have finished processing and all other CPU cores are idle). It could have handled more updates in parallel on other canisters though, had we not introduced this 1 CPU core limit earlier this week (to this one subnet).

As for read-only queries, it could have probably handled about 2x the traffic, but currently the rate limiting is static and it would need to be dynamic (based on actual replica load) in order to scale with the capacity instead of needing to be conservative.

Also it is very interesting to know the relation between adding nodes to subnet and throughput for updates, how many updates can handle one submet?

Adding more nodes to a subnet will not increase update throughput. All replicas execute all updates in the same order, so update throughput would be exactly the same, but latency would be increased (because Gossip and Consensus need to replicate ingress and consensus artifacts to more machines and tail latency increases).

It would increase read-only query capacity though, proportionally to the number of replicas (as each query is handled by a single replica).

5 Likes

Also

  1. Does the current cycles model truly reflect the consumption of physical resources (of course, the cycles model not only needs to consider the consumption of physical resources, but also needs to consider lowering the threshold for developers, etc.), and is there any subsequent adjustment plan? There was an unreasonable gas price setting for an op code in Ethereum, which led to an attack by DDoS.
  2. Is there an accurate description of all operations that consume cycles so that developers can practice best practices.
2 Likes

The cycles model does reflect the cost of physical resources, but while it did involve careful thinking, it is based on test loads and estimates, not real-world traffic (which didn’t exist back when the cycle model was produced). As a result, it is very likely to get adjusted, although no clear plans for that are yet in place.

  1. Is there an accurate description of all operations that consume cycles so that developers can practice best practices.

Here is everything that is currently being charged for and the cycle costs. But I would optimize for performance in general rather than cycle costs specifically, as cycle costs are quite likely to follow performance at some point in the future (as in, everything that’s slow or causes contention or whatever is likely to cost more and the other way around).

5 Likes

This is exactly what I assumed. In that case to achieve write performance, I need to deploy canister to many subnets and do data sharding on the application level. Am I right?

2 Likes

I belive that this could solve the problem. Now the question is how to make proper sharding :slight_smile:

Not necessarily to many subnets, a single subnet might suffice. (Think of subnets as VMs and canisters as single-threaded processes. In this instance.) You can likely scale quite a bit on a single subnet (by adding more canisters) before you need to scale out to other subnets.

Once you start scaling across subnets, if there’s any interaction between canisters (and I would assume there would be at least some for most applications) you have to account for XNet (cross-net) latency, which is more or less 2x ingress latency (the “server” subnet needs to induct the request, the “client” subnet the response). Whereas on a single subnet without a backlog of messages to process this roundtrip communication could even happen within a single round.

3 Likes