Ah sorry, here is the link to the spec on smartcontracts.org
Thank you, I am very excited for this.
If I interpret the specification right, ic0.performance_counter counts all in-canister Wasm instructions from the entry point invocation, including chained functions. Does it also count instructions executed in other canisters from inter-canister calls?
Very useful distinction to understand how actor messaging on the IC works.
@chenyan @berestovskyy Would you happen to know? I’m curious about this as well.
Actually, this might be the answer: Calculate an estimate of cycles consumption: a universal example - #6 by domwoe
hey @gabe,
The perf counter is in WASM instructions, and it starts from zero at the beginning of each execution. It’s a bit tricky with the actor model, as every await is a new execution.
I just created an example of the Cycles balance and Perf Counter during the inter-canister calls on Wiki, please have a look: Comparing Canister Cycles vs Performance Counter - Internet Computer Wiki
@jzxchiang At the moment the perf counter starts from zero for each new execution. We could preserve the counter and continue it after the await, but it gets tricky when we have a few calls in flight…
So for now please use the perf counter only for the “normal” WASM code, not across inter-canister calls.
This wiki is a really great resource, thanks.
This is great! Thank you for sharing.
For others reading this thread, I can recommend this thread as well.
it’s very cool @gabe, very detailed page ![]() Looking forward to see a blog post!
Looking forward to see a blog post!
And sure, if you have more questions, we are here to help!
Thank you! I’m glad people appreciate it. ![]()
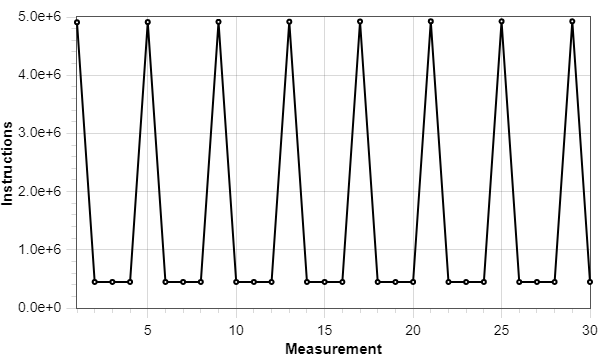
I have a question regarding the number of instructions I am getting from measurements of a particular entry point. I am using the profiling mode in Playground for the measurements and measured the instruction count 30 times.
Here is a plot of the data:
Here are some statistics:

And here is the raw data:
{
"x":[1, 2, 3, 4, 5, 6, 7, 8, 9, 10, 11, 12, 13, 14, 15, 16, 17, 18, 19, 20, 21, 22, 23, 24, 25, 26, 27, 28, 29, 30],
"y":[4909516, 446697, 446697, 446697, 4913081, 446697, 446697, 446697, 4916251, 446697, 446697, 446697, 4919456, 446697, 446697, 446697, 4922661, 446697, 446697, 446697, 4925866, 446697, 446697, 446697, 4925866, 446697, 446697, 446697, 4925866, 446697]
}
Each bottom of the pattern is exactly 446,697 instructions.
Below is some simplified pseudo-ish code of what the entry point does:
let messages: TrieMap<MessageId, Message>;

let userToReceivedIds: TrieMap<Principal, List<MessageId>>;
let userToSentIds: TrieMap<Principal, List<MessageId>>;

  // Stores the message and adds the ID to the sender's sent IDs and each recipient's received IDs.
  func addMessage(message: Message) {
    messages.put(message.header.id, message);

    // Add message ID to sender' sent messages.
    let currentIdList = userToSentIds.get(message.header.from);
    let newIdList = List.push(message.header.id, currentIdList);
    userToSentIdsMap.put(message.header.from, newIdList);

    // Add message ID to each recipients received messages.
    let currentIdList = userToReceivedIds.get(message.header.to);
    let newIdList = List.push(message.header.id, currentIdList);
    userToReceivedIdsMap.put(message.header.to, newIdList);
  };
So basically there are two get from two TrieMaps, two push to two Lists, and three put to three TrieMaps.
Do you know what could be causing this repeating triangle/sawtooth pattern? I am very curious to know since the difference between the bottoms (446,697) and the peaks (max 4,925,866) is huge.
Do you force GC when compiling the canister? I suspect the difference is due to whether GC is triggered.
Sounds like a very valid guess. To be honest, I am not really sure. I use the default canister settings.
Yep, the default flag only triggers GC when there are enough changes from last GC. In the playground, there is a checkbox “Force garbage collection (only if you want to test GC)” to enable GC for every message.
That must be it then, thank you!
What is considered enough changes?
Also, as a bonus question: is the stable memory in canisters deployed in the Playground capped to a size of less than 4 GB? If so, can I bypass it e.g by sending more cycles to it?
Here is the current parameter: motoko/Changelog.md at master · dfinity/motoko · GitHub
The playground caps stable memory at 1G. If you want to experiment with stable memory, is it easier to deploy locally?
Perfect, thank you!
Definitely much easier. The thing is that I am using the profiler in Playground to count instructions, and have not had time to fiddle with that in a local environment yet.
I am measuring wasm instruction count with forced GC (copying) and get the following linear pattern:

In each measurement, I push an element to a list and put it in a TrieMap. Each element is of the same size and the canister’s state is not reset between measurements.
Do you know what could be causing the linear pattern in instruction count?
Could be related to forcing GC. The container size is increasing each time, causing the GC to copy more data after each insertion.
Good point. The amount of useful data that the GC has to copy grows linearly.
I was speculating around the fact that I am using a Trie structure. AFAIK, the Motoko Trie implementation produces a new copy of the trie for each put. I assume that the memory of the obsolete Trie is freed by the GC, but I am not sure if this would result in a higher number of instructions. Do you have any thoughts on this?
That’s a common pattern with all copying garbage collectors: GC time grows linearly with the size of the working set. Pusher engineers wrote a nice article about problems they experienced with the GHC GC: Low latency, large working set, and GHC’s garbage collector: pick two of three | Pusher blog
Insertions into a Trie don’t require copying the entire data structure, only a few nodes that changed. In addition, with a copying GC, it’s not important how much garbage you have on the heap, only how much live memory you have.