@alexeychirkov, no news as far as I am aware. But an upgrade would have a memory “reset” effect indeed.
@rossberg Please can you share a snippet of code in RUST that gives memory and heap memory size programmatically?
I mean analogy for Prim.rts_memory_size() and Prim.rts_heap_size()
Sorry, I don’t know. Somebody from the Rust CDK team will have to answer that.
Can you please mention correct teammates?
Maybe @roman-kashitsyn or @lwshang?
core::arch::wasm32::memory_size function will give you the memory size in 64KiB pages.
Heap size is a bit more involved, I don’t think there is an API that gives you that directly.
You can get the size of currently allocated objects by defining a custom global allocator that keeps track of allocations, std::alloc::System docs provide an example.
If you serialize/deserialize the whole state on upgrade, this can actually make things worse: Motoko canister memory size increased after upgrade - #6 by roman-kashitsyn
In Rust, Candid encoding for serde_bytes::ByteBuf is much more efficient compared to Vec<u8>.
In case of Vec<u8>, the encoder treats the data as a generic array, encoding each byte as a separate value, one at a time. Same inefficiency affects on the decoding side.
In case of ByteBuf, the encoder records the blob size and then memcopies the contents into the output buffer. This is much more efficient (I observed 3x-10x reduction in cycle consumption for large byte arrays). Note that this is not just Candid issue, the same is true for any serde backend.
I assume that Motoko implementation has similar peculiarities when it comes to Blob vs [Nat8], but I’m not 100% sure.
In Motoko, a vec nat8:
-
consumed as a Motoko
Blobwill deserialize into a compact object using on byte pernat8, plus a small, constant size header for theBlobobject. -
consumed as Motoko
[Nat8]will deserialize in a Motoko array, using 4-bytes pernat8, plus a small, constant size header for theBlobobject.
[Nat8] is thus 4 times larger than the equivalent Blob. It also has much higher GC cost as the GC needs to scan every entry of the array, in case it could be a heap allocated object, while it will know that a Blob contains no further object references and can be skipped.
The array representation could be optimized better to reduce size and GC cost, but that’s the situation at the moment, and the optimization won’t come soon.
@roman-kashitsyn I tried the above but got an error saying not found in core::arch::wasm32
The Stack Overflow comment below suggests that the Rust standard library needs to be recompiled with different flags in order for that to work.
Do you know anything about that?
“The rust standard library itself is not by default compiled with these gates enabled and so even when you enable them in your program, they are not present in the standard library binary. You can solve this by getting standard library source with rustup and recompiling it with necessary flags.”
Actually, the Stack Overflow post says: core::arch::wasm32::memory_size(3); /*<-- this line works since it is stable */
So perhaps all I’m missing is: #[cfg(target_arch = "wasm32")]
This might be what I am encountering here.
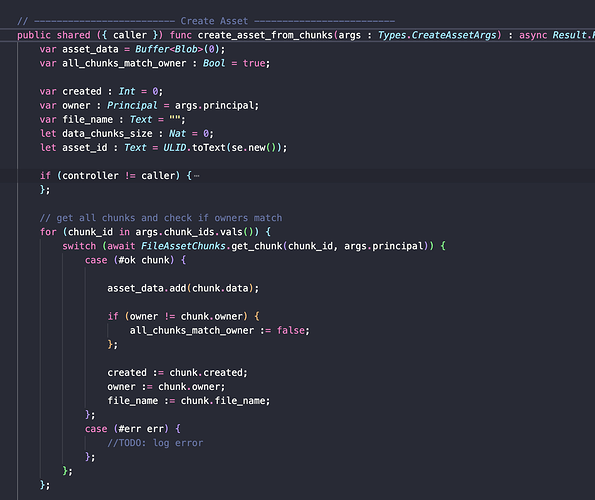
The heap keeps increasing and not going down. Right now I am grabbing 2mb chunks from another canister and placing them in var asset_data = Buffer<Blob>(0); After say 15mb I store the object in private var assets : HashMap.HashMap<Text, Types.Asset> = HashMap.HashMap<Text, Types.Asset>( 0, Text.equal, Text.hash ); I just don’t know why heap stays the same even after the main call public shared ({ caller }) func create_asset_from_chunks finishes executing. Shouldn’t var asset_data = Buffer<Blob>(0); be garbage collected? I will spawn a new assets canister when memory reaches 1.8GB so might not be an issue but was wondering why it is happening.
Unless you manually clear the buffer or assign a new, empty buffer into the var, all the Blob data will be referenced from the var, considered live, and not reclaimed by GC.
Oh thanks. I didn’t know that variables inside an actor method are not GC after the method ends. I only thought variables outside the methods are persisted. Good to know. Thank you.
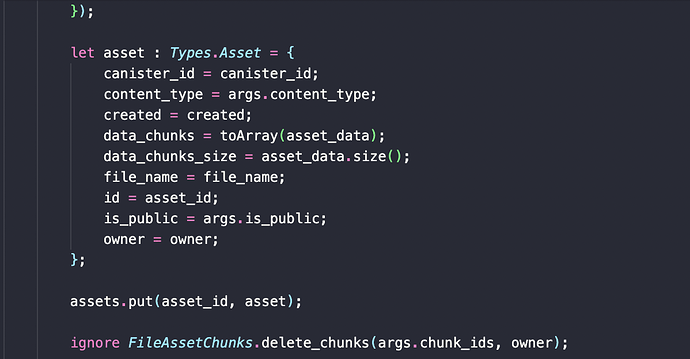
If I convert that buffer to an array in a record do I have to clear that up as well. Example
let asset : Types.Asset = { canister_id = canister_id; content_type = args.content_type; created = created; data_chunks = toArray(asset_data); data_chunks_size = asset_data.size(); file_name = file_name; id = asset_id; is_public = args.is_public; owner = owner; };
Cleared the buffer with asset_data.clear(); but still seeing heap mem increasing.
Local variables inside a method should not keep data live once the method returns unless they escape into a closure or object that remains live.
Note that GC does not run after every message. Instead, after every message, the runtime decides whether GC is required because memory has grown a lot or memory is getting low and only runs the GC if deemed necessary.
If ‘asset_data’ remains live, then yes.
15MB is not a lot of data so perhaps the GC just hasn’t had a chance to run in your example.
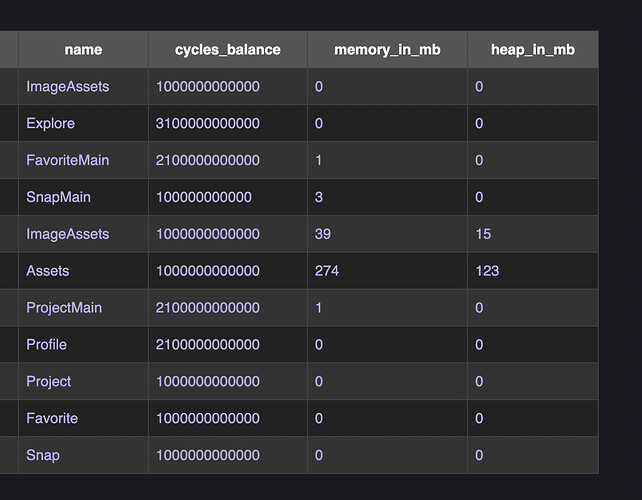
This is how it grows relative to stable memory. This is local env. this is uploading the same size file each time.
this is what happens in the method create_asset_from_chunks. Gets chunks from FileAssetChunks and stores them in asset_data. After it is done calling FileAssetChunks with all chunks it then stores it in
And also before storying it converts to array.
Using Prim.rts_heap_size(); and Prim.rts_memory_size(); for heap_in_mb and memory_in_mb (converted to MB of course)
I’m not really sure what is going on and on mobile at the moment.
Note that, in general, the ‘rts_*’ prims reflect the status after the last message, not the current one, since they are updated after a GC.
You can also use moc flag ‘–force-gc’ to force a GC after every message to get more accurate measurements (but don’t use the flag in production as it leads to quadratic behaviour)
Just curious, is that you custom built UI to monitor canister memory?
Asking because I’m a developer of Canistergeek tool
Yeah I built the UI to monitor memory


